Simple Livability Index: Measuring Quality of Life Across City Districts
geospatial
map
Livability Index
Introduction
Finding the perfect place to live isn’t just about personal preferences—it’s also about the environment, opportunities, and overall quality of life a neighborhood can offer. The Simple Livability Index aims to provide a clear, data-driven way to compare different city districts, scoring each one from 1 to 10 based on key livability factors.
Why This Matters
Whether you’re a policymaker, an urban planner, or someone looking for the best place to live, having a standardized livability score can help make informed decisions. By evaluating districts across multiple dimensions, we can highlight strengths, identify areas for improvement, and create a more balanced and livable city.
The Five Key Dimensions of Livability
We assess each district based on five core factors that contribute to quality of life:
- Accessibility and Mobility 🚇
- How easy is it to get around?
- Availability of public transportation, road infrastructure, and walkability.
- Traffic congestion and average commute times.
- Green Spaces and Recreation 🌳
- Presence of parks, playgrounds, and recreational areas.
- Accessibility of green spaces for residents.
- Availability of walking and cycling paths.
- Public Services and Amenities 🏥
- Quality and availability of healthcare, education, and public services.
- Access to libraries, sports facilities, and community centers.
- Availability of essential services like supermarkets and banks.
- Safety and Security 🚔
- Crime rates and general safety perception.
- Presence of emergency services and response times.
- Well-lit streets and pedestrian-friendly zones.
- Economic Opportunities 💼
- Job availability and employment rates.
- Average income levels and cost of living.
- Presence of business hubs, startups, and commercial areas.
How We Calculate the Livability Score
Our approach combines open-source data and analytical modeling to ensure a fair and accurate assessment:
- Data Collection 📊
- We source city district data from OpenStreetMap (OSM) and other relevant sources to gather information on infrastructure, amenities, and economic factors.
- Key Performance Indicators (KPIs) 📉
- We define measurable KPIs for each dimension—such as the number of bus stops per square kilometer, crime incidents per 1,000 residents, or the percentage of green space in a district.
- Scoring System (1-10) 📏
- Each KPI is normalized on a scale of 1 to 10, ensuring that every district is evaluated consistently.
- A score of 1 indicates poor performance, while 10 represents an optimal living environment.
- Final Livability Index 🏆
- We combine the five dimension scores into a single unified index.
- Districts are ranked to provide a comparative analysis of livability across the city.
- Mapping & Visualization 🗺️
- The final scores are plotted on a city-wide interactive map, making it easy to see which areas excel and which need improvement.
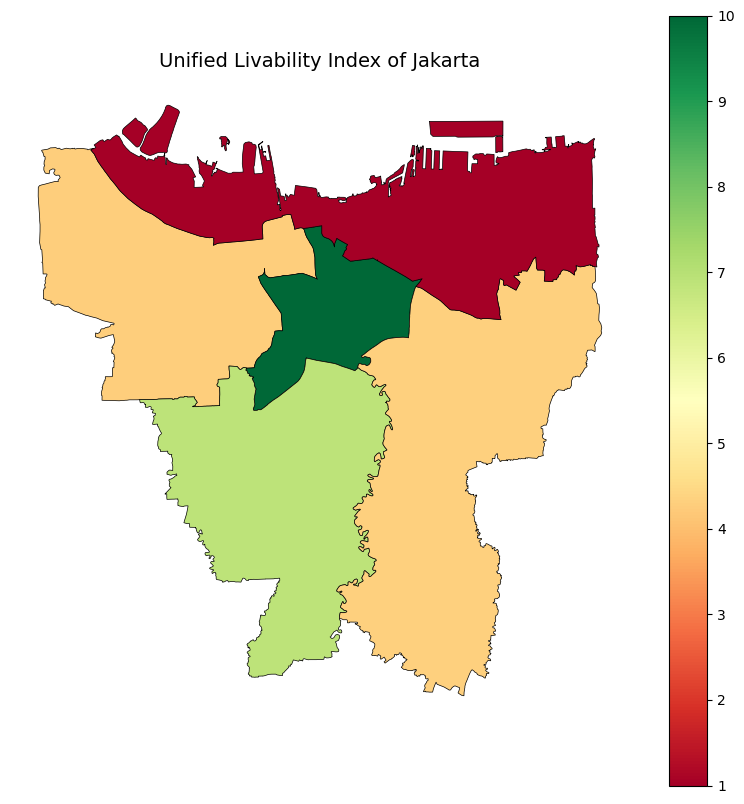
By using parameters above, we can calculate sum all normilized and weighted parameters to get Unified Livability Index.
we can use this weight values as reference for this project:
weights = {
    'Road Density': 0.1,
    'Public Transport Density': 0.15,
    'Park Coverage': 0.1,
    'Recreation Density': 0.1,
    'Healthcare Accessibility': 0.1,
    'Education Accessibility': 0.1,
    'Emergency Services Density': 0.1,
    'Living Street Coverage': 0.1,
    'Retail Density': 0.15,
    'Employment Centers Density': 0.1
}
Dataset
Load dataset
For this project, we are going to collect all data from all district in Jakarta province there are ['Jakarta Timur', 'Jakarta Pusat', 'Jakarta Barat','Jakarta Utara', 'Jakarta Selatan'] from OpenStreetMap (OMS).
From OpenStreetMap (OMS), we collect main data such as:
- Districts Geometries
- Accessibility and Mobility
- Roads Graph
- Public Transport Graph
- Green Spaces and Recreation
- Parks Area
- Recreation Area
- Public Services and Amenities
- Healthcare Location
- Education Location
- Safety and Security
- Emergency_services Location
- Living_street Area
- Economic Opportunities
- Commerce Location
- Employment Centers Location
The Code
To conduct this analysis, we can used several previous code to get all data.
maps.get_geodata_areawithtypes= 'polygon'- get polygon area datamaps.get_geodata_areawithtypes= 'graph'- get roads graphmaps.extract_spatialwith specificamenity_list- get all requirement features from specific area.
result = maps.get_geodata_area(places= [])

nodes, edges = maps.get_geodata_area(places= [], amenity_list= None, types= 'graph', network_type='drive')

result = maps.extract_spatial(boundary, amenity_list= amenity_list, place_at='')
The Data
Roads
| osmid | highway | lanes | name | oneway | reversed | length | width | geometry | service | |
|---|---|---|---|---|---|---|---|---|---|---|
| (90653275, 1641060576, 0) | 10521974 | tertiary | 1 | Jalan UI | False | False | 14.5785 | nan | LINESTRING (106.8316146 -6.3518652) | nan |
| (90653275, 1641060702, 0) | 1223456405 | tertiary | 2 | Jalan Prof. Dr. Miriam Budiardjo | True | False | 72.4339 | 6 | LINESTRING (106.8316146 -6.3518652) | nan |
public_transport
| element | id | bus | name | public_transport | network | operator | ref | addr:city | addr:country | |
|---|---|---|---|---|---|---|---|---|---|---|
| 0 | node | 103287853 | yes | Tebet Barat Dalam | stop_position | |||||
| 1 | node | 307353279 | yes | SMP Tarakanita 5 | stop_position |
park
| element | id | addr:city | addr:postcode | addr:street | leisure | name | opening_hours | operator | addr:housename | |
|---|---|---|---|---|---|---|---|---|---|---|
| 0 | node | 8189134684 | DKI Jakarta | 12780 | Jalan Pancoran Barat IV D | park | pasar pagi gang tabah | Mo-Su 06:00-10:00 | people | |
| 1 | node | 10023493497 | park | PT satria teknologi pratama |
recreation
| element | id | leisure | sport | access | contact:phone | lit | name | surface | addr:city | |
|---|---|---|---|---|---|---|---|---|---|---|
| 0 | node | 10002654986 | pitch | basketball | ||||||
| 1 | node | 10058647615 | pitch | futsal | customers | +6281996956200 | yes | Futsal PSPT Tebet Timur | paved |
healthcare
| element | id | amenity | brand | brand:wikidata | healthcare | name | addr:city | addr:housenumber | addr:postcode | |
|---|---|---|---|---|---|---|---|---|---|---|
| 0 | node | 1395484939 | pharmacy | Guardian | Q63371124 | pharmacy | Guardian | |||
| 1 | node | 3742132719 | pharmacy | pharmacy |
education
| element | id | amenity | name | addr:city | source | operator | wheelchair | addr:housenumber | addr:postcode | |
|---|---|---|---|---|---|---|---|---|---|---|
| 0 | node | 3180186217 | school | Yayasan Darul Marfu’ | ||||||
| 1 | node | 5082955316 | school | Heritage School | DKI Jakarta | HOT_InAWARESurvey_2017 |
emergency_services
| element | id | amenity | name | addr:city | addr:housenumber | addr:postcode | addr:street | healthcare | operator | |
|---|---|---|---|---|---|---|---|---|---|---|
| 0 | node | 1695722353 | police | Pos Polisi Blok M | ||||||
| 1 | node | 3128699535 | police | Pos Polisi |
living_street
| element | id | highway | motorcar | motorcycle | name | oneway | smoothness | source | surface | |
|---|---|---|---|---|---|---|---|---|---|---|
| 0 | way | 28213277 | living_street | destination | yes | Jalan Pedurenan Masjid II | no | good | HOT_InAWARESurvey_2017 | asphalt |
| 1 | way | 28224990 | living_street | yes | Jalan Setiabudi Timur 2 | no | intermediate | HOT_InAWARESurvey_2017 | ground |
commerce
| element | id | name:en | shop | name | opening_hours | brand | brand:wikidata | brand:wikipedia | addr:city | |
|---|---|---|---|---|---|---|---|---|---|---|
| 0 | node | 320846458 | Sanitair Shops along the corner | variety_store | ||||||
| 1 | node | 321221315 | supermarket | Foodmart Fresh Plaza Semanggi | 10:00-22:00 |
employment_centers
| element | id | name | office | addr:city | addr:housename | addr:housenumber | addr:street | addr:postcode | description | |
|---|---|---|---|---|---|---|---|---|---|---|
| 0 | node | 1774692085 | Jne Setiabudi | company | ||||||
| 1 | node | 2565952960 | Konsorsium Reformasi Hukum Nasional | ngo | Jakarta Selatan | KRHN | 13 | Tebet Utara 2 |
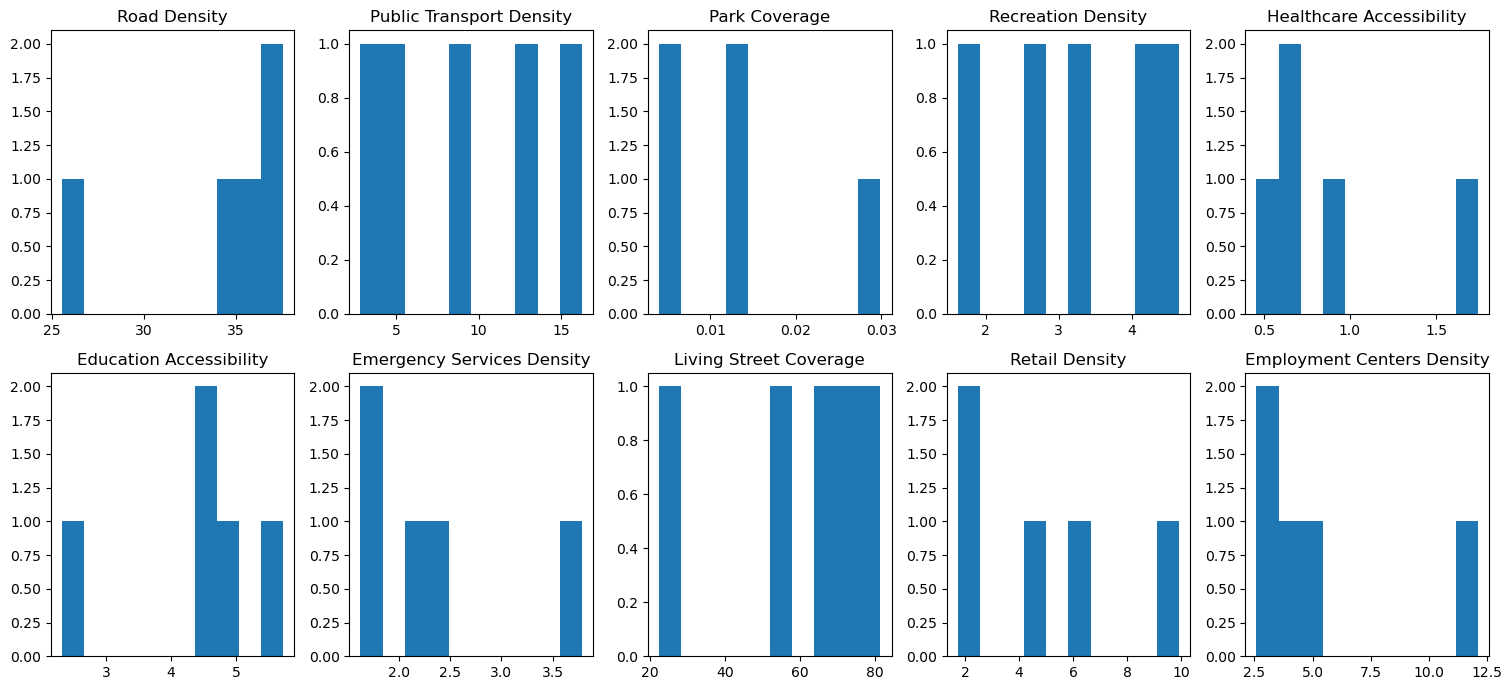
The result
in Table
| Place | Road Density | Public Transport Density | Park Coverage | Recreation Density | Healthcare Accessibility | Education Accessibility | Emergency Services Density | Living Street Coverage | Retail Density | Employment Centers Density |
|---|---|---|---|---|---|---|---|---|---|---|
| Jakarta Barat | 35.6802 | 5.31926 | 0.00400706 | 2.6417 | 0.621576 | 4.65585 | 2.24126 | 66.7238 | 4.84112 | 3.55016 |
| Jakarta Pusat | 36.6915 | 16.2528 | 0.0298861 | 4.26598 | 1.74244 | 5.72302 | 3.7853 | 55.4577 | 9.91389 | 12.107 |
| Jakarta Selatan | 37.544 | 13.3157 | 0.0132892 | 4.64474 | 0.850524 | 4.99268 | 2.43007 | 73.7857 | 5.93157 | 4.93193 |
| Jakarta Timur | 34.4746 | 8.66067 | 0.0142928 | 3.19347 | 0.457902 | 4.40534 | 1.71319 | 81.4277 | 1.73292 | 2.93689 |
| Jakarta Utara | 25.5419 | 2.83625 | 0.0064461 | 1.61888 | 0.666348 | 2.31513 | 1.62315 | 22.3739 | 2.0503 | 2.58423 |
Normalized, Weighted, with calculated Unified Index
| Place | Road Density | Public Transport Density | Park Coverage | Recreation Density | Healthcare Accessibility | Education Accessibility | Emergency Services Density | Living Street Coverage | Retail Density | Employment Centers Density | Unified Index |
|---|---|---|---|---|---|---|---|---|---|---|---|
| Jakarta Barat | 8.60245 | 2.66564 | 1 | 4.04222 | 2.14677 | 7.18167 | 3.57288 | 7.75908 | 4.41937 | 1.9129 | 4.29 |
| Jakarta Pusat | 9.36076 | 10 | 10 | 8.87342 | 10 | 10 | 10 | 6.04209 | 10 | 10 | 10 |
| Jakarta Selatan | 10 | 8.02974 | 4.22805 | 10 | 3.75086 | 8.07124 | 4.3588 | 8.83534 | 5.619 | 3.21883 | 6.88 |
| Jakarta Timur | 7.69842 | 4.90711 | 4.57709 | 5.6834 | 1 | 6.52009 | 1.37476 | 10 | 1 | 1.3333 | 4.31 |
| Jakarta Utara | 1 | 1 | 1.84823 | 1 | 2.46045 | 1 | 1 | 1 | 1.34915 | 1 | 1 |
in Graphic
Final Thoughts
The Simple Livability Index is more than just a number—it’s a tool to help communities, city officials, and residents better understand their urban environment. By identifying both strengths and challenges, this index can support smarter urban planning, equitable development, and a better quality of life for all.